If you’re into finance-related content on YouTube, you’ve probably seen all these ads where someone is making 20k a month with their crypto signals and that you should definitely join their Telegram group too. Although 99.9% of these groups are definitely scams and don’t work at all, I wanted to review how a select group has performed in the past. Note that this is not a public group, but a paid group that I will be backtesting. I got access to this group through my work colleague whose company has access to this group.
Disclaimer The script and analysis presented in this post have not been verified by external parties. The results of my analysis may be inaccurate, as there might be factors I did not consider in my calculations. There may also be a significant tracking error compared to the “index” (the signals). You should conduct your own research, and please note that this is not financial advice.
You can view all the code used in this study on Github.
About the Signals
The signals of the Telegram Channel I analyzed looked like this:
📩 #ARUSDT

Long | Entry: 28.658

Strategy name: #ARUSDT ARUSDT15-15USDTPERP - Binance Futures | 15 min timeframe

— 📤 Signal details —

Target 1 : 29.23 probability 100%

Target 2 : 29.80 probability 92%

Target 3 : 30.38 probability 86%

Target 4 : 32.10 probability 72%

⛔ Stop-Loss: 25.79 or opposite signal 🔀 or add more at the dip 🔽

🏦 Leverage: 10x cross
If you’re new to crypto, here is a brief explanation of the terms used in the trading signals:
- Trading Pair: AR/USDT (trading Arweave against USD Tether coin)
- Trading Direction: Long (profiting from an increase in value)
- Entry: 28.658 (the entry price for the trade)
- Targets/Take Profits (TP): 29.23, 29.80, 30.38, 32.10 (prices at which to close the trade and secure profits)
- Stop-Loss (SL): 25.79 (price at which to close the trade to limit your loss)
- Leverage: 10 (if you invest $100 with a leverage of 10, your position is $1000 in size)
Our Strategy
While the signal gives us the take profit and stop loss, we can still adjust our strategy around it. After some testing with different approaches, I have found that the following one gives the best risk-adjusted profits.
Normally this is not the best approach as you don’t know the best approach at the beginning (hindsight). However, I have decided on this idea, so take it with a grain of salt.
The strategy includes 4 take profit targets that decrease exponentially as positions are closed. In addition, a trailing stop mechanism is used which continuously adjusts the stop loss to the last target reached. When the first profit target is reached, the stop is moved to break-even; when the second target is reached, it is adjusted to the first target price and so on.
Procedure of the Backtest
Data Preparation
- Export Telegram Channel Data: Extract the data from the Telegram channel.
- Filter Relevant Messages: Identify and filter messages that contain trading signals.
- Extract Trade Information: Parse each relevant message to extract trade details.
- Organize Trade Information: Store the extracted trade details in a JSON file.
Trade Simulation
- Enter the Trade: Simulate entering the trade based on the entry price.
- Check for SL and TPs: Monitor the trade to determine if it hits the stop-loss or any of the profit targets.
- Calculate ROI: Compute the return on investment (profit or loss) for each trade.
- Record Results: Add the ROI along with the trade’s closing date to a CSV file.
Data Analysis
- Group ROI by Date: Aggregate the ROI data by date to calculate the average profit or loss per day.
- Plot Average ROI: Create a plot of the average daily ROI and include the mean value to indicate overall profitability (excluding trading fees).
- Set Trading Parameters: Define trading parameters such as fees, margin, etc.
- Calculate Portfolio Balance: Compute the day-over-day portfolio balance applying the defined parameters.
- Calculate Risk Parameters: Evaluate risk metrics like volatility and Sharpe ratio.
- Plot Account Balance: Visualize the account balance over time for each trade to assess strategy performance in a practical environment, including trading fees.
Results of the Backtest

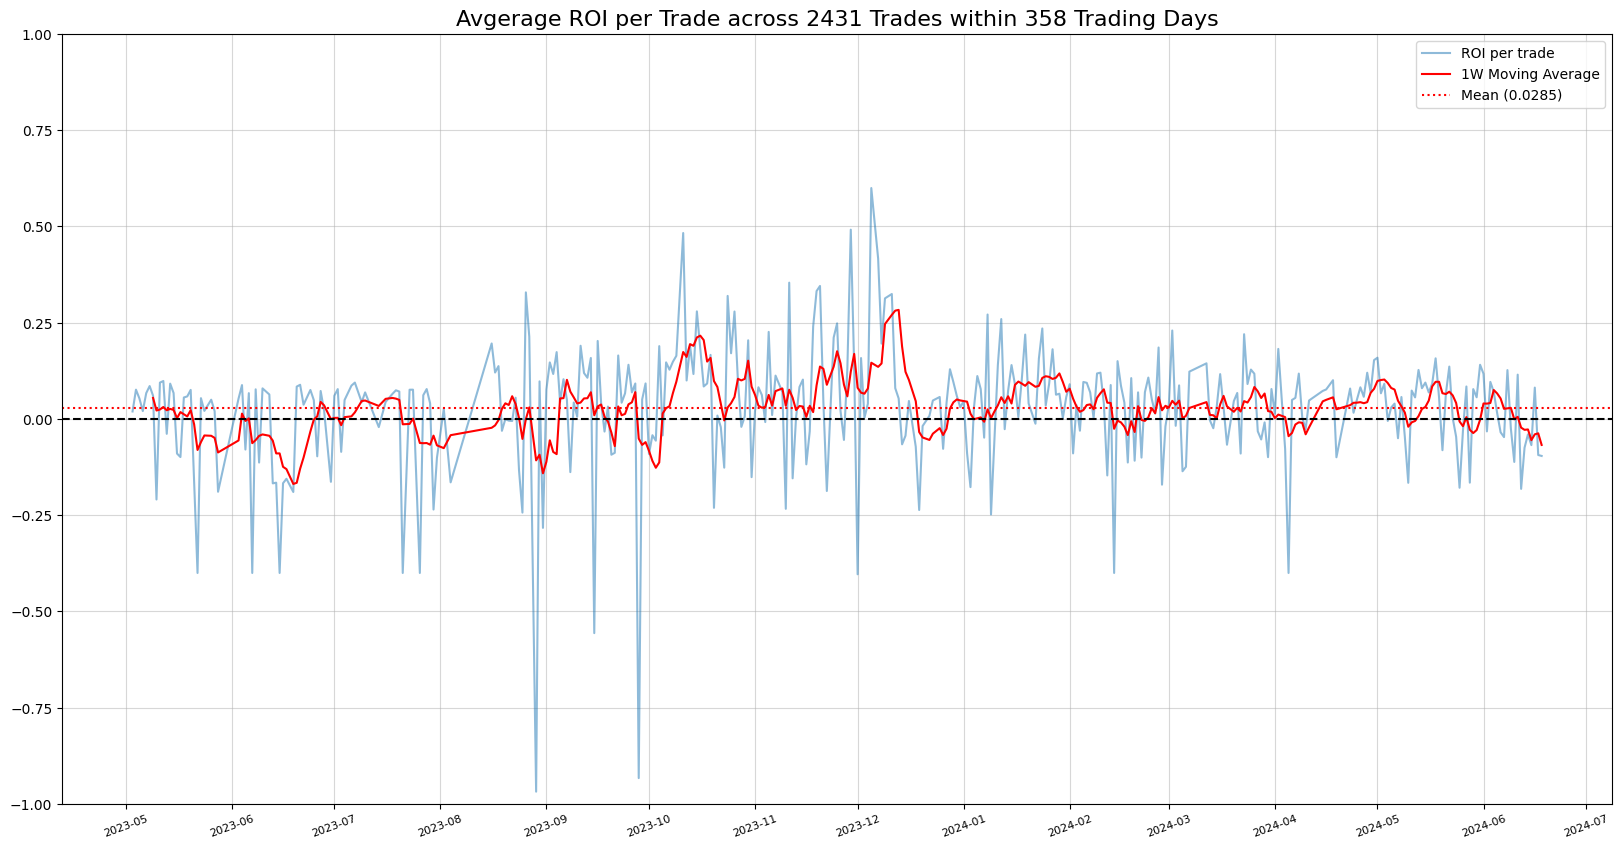
I have analyzed data from approximately May 2023 to today, which results in 2431 trades in 358 trading days. This essentially means that a trade has taken place almost every day with an average of 6.8 trades per day. To be honest, the results look really good. As you can see, the average trade yields a profit of 2.85%, which is going to increase insanely over time. But since this is too good to be true, there must be a catch, right? Yes, of course, and that is that the fees are excluded. So let’s take a look at what happens when you subtract the fees and add a little more spice with leverage.
We examine parameters such as taker fee, maker fee, funding fee, margin, and leverage. The Taker fee, typically between 0.04% and 0.06% of the position size, is charged when entering a trade. The Maker fee, about half the size of the taker fee, is charged upon trade closure. For simplicity, I’ve assumed a conservative total taker fee of 0.1%. The funding fee and average funding cycles per trade occur every 8 hours, transferring payments between Short Traders and Long Traders, based on trade duration. With an average trade open for one day, this equates to approximately 3 funding cycles (24h / 8h). Margin represents the percentage of the account balance used for trading (e.g., 0.02 for 2%). Leverage multiplies fees based on the position size, not the initial investment margin.
INITIAL = 1000
MARGIN = 0.02 # 2%
TAKER_FEE = 0.001  # 0.1%
FUNDING_FEE = 0.0002  # 0.02%
LEVERAGE = 10
AVG_FUNDING_CYCLES_PER_TRADE = 3  # 24h Avg. Trade Length
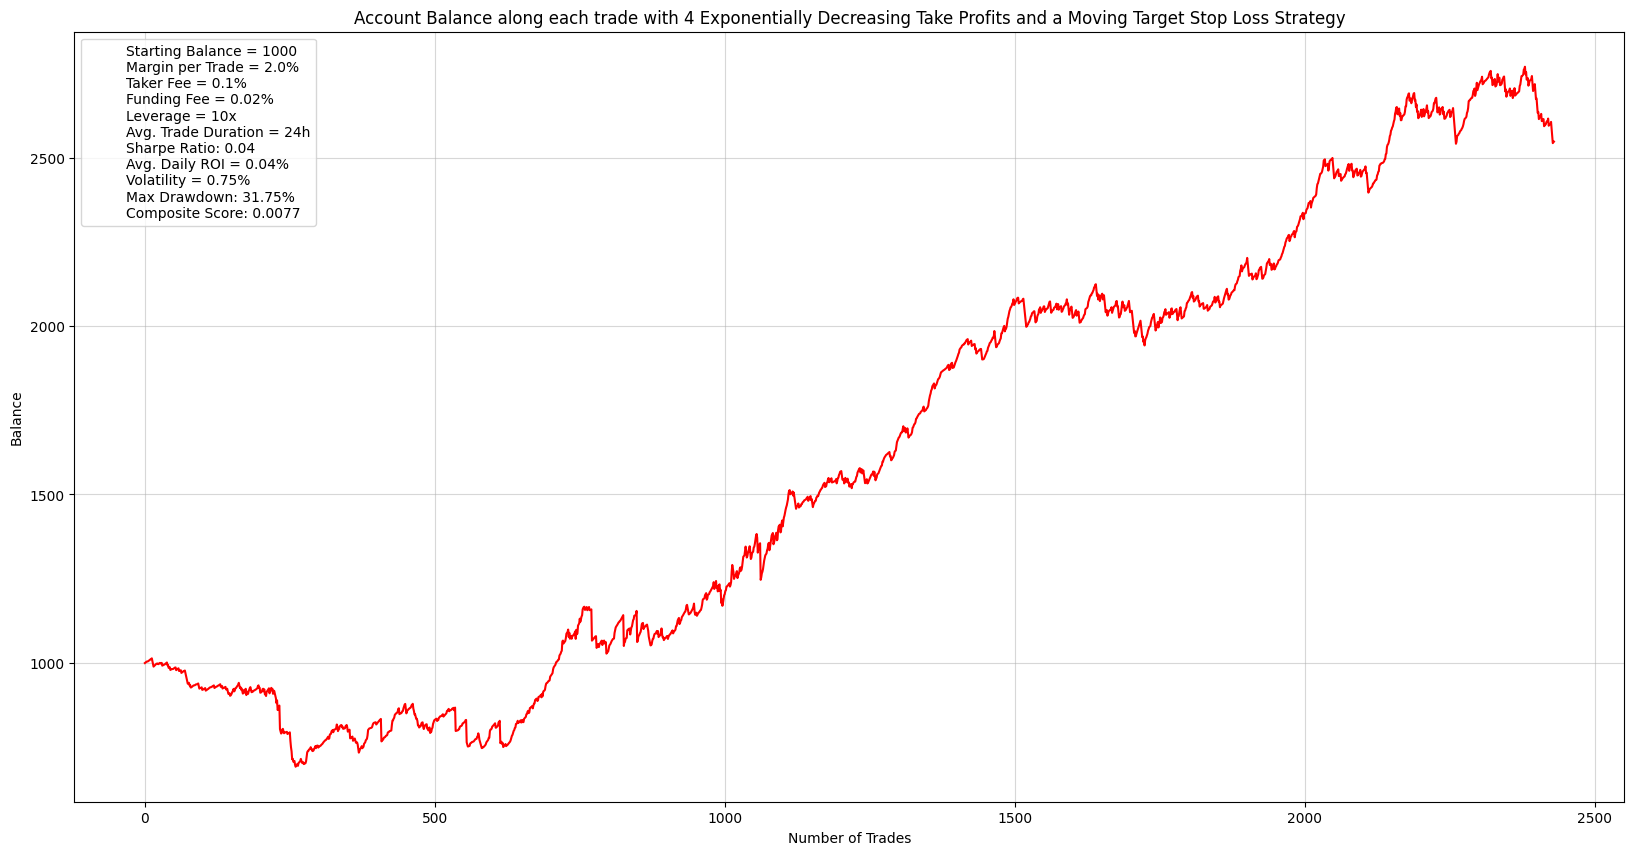
If we now add the compounding mechanism by adding each absolute trading profit, we get the account balance over time, starting with 1k initial deposit:

As seen above, this strategy appears to be profitable. Before fees and trading parameters are taken into account, it generates an average daily return of 2.85%. Using these parameters, an initial investment of $1000 on May 1, 2023 would generate a return of $2,500 by June 18, 2024.
Important: Although this backtest seems to outperform Bitcoin by 23% over the same period (150%+ return compared to 127%), the Sharpe Ratio in the top left is close to 0, which means that the risk-adjusted statistic is not really good.
Conclusion
I hope you found this study interesting! Please remain skeptical and do not rely on this study as errors may have occurred. However, it shows that not every Telegram Crypto Signals Group is ineffective.
I would not recommend going with any of these groups. Either learn to trade yourself, just HODL Bitcoin like Michael Saylor does, or check out Crypticorn, a machine learning approach to crypto trading that I am heavily involved in.