The European Football Championship is in full swing and, fittingly, I had the idea to develop a betting strategy for the upcoming Bundesliga season. Let´s analyze some historical data and develop a thesis. We will be using data from OpenLigaDB from 2009/10 to 2023/24 and explore statistics like the distribution of match outcomes, results by winning team, and scoring times.
In this post, the data is processed and visualized using Python, Plotly and Matplotlib. Our aim is to uncover trends and patterns that will be useful for a follow-up post on value betting strategies, focusing specifically on bets on more than 0.5 goals.
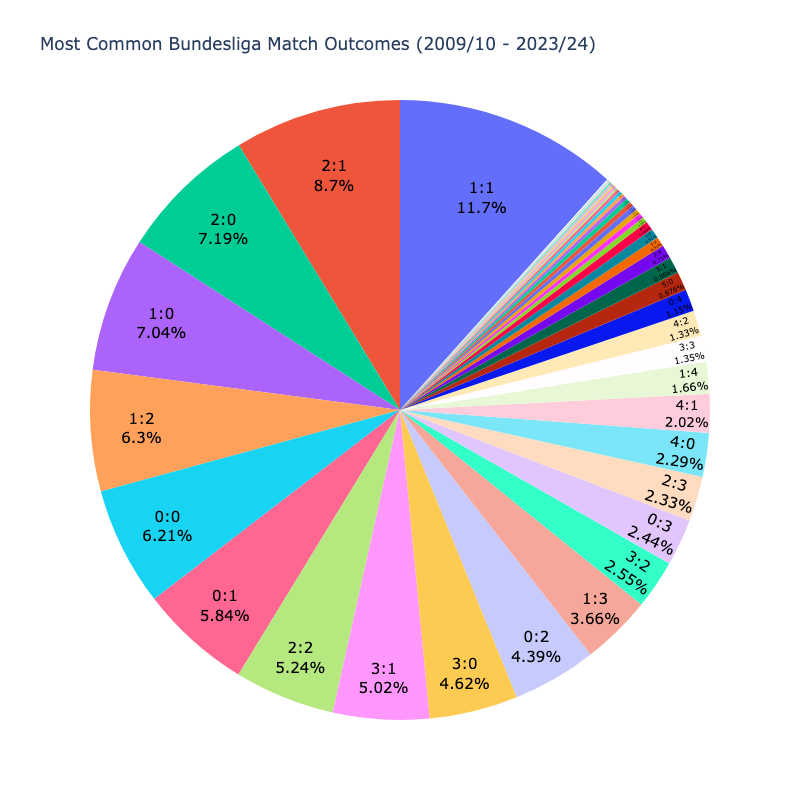
This pie chart displays the distribution of the most common match outcomes in Bundesliga games from the 2009/10 season to the 2023/24 season. Each slice of the pie represents a different match outcome, with the size of each slice indicating the proportion of matches that ended with that specific scoreline.
1:1 Leading for 14 Seasons
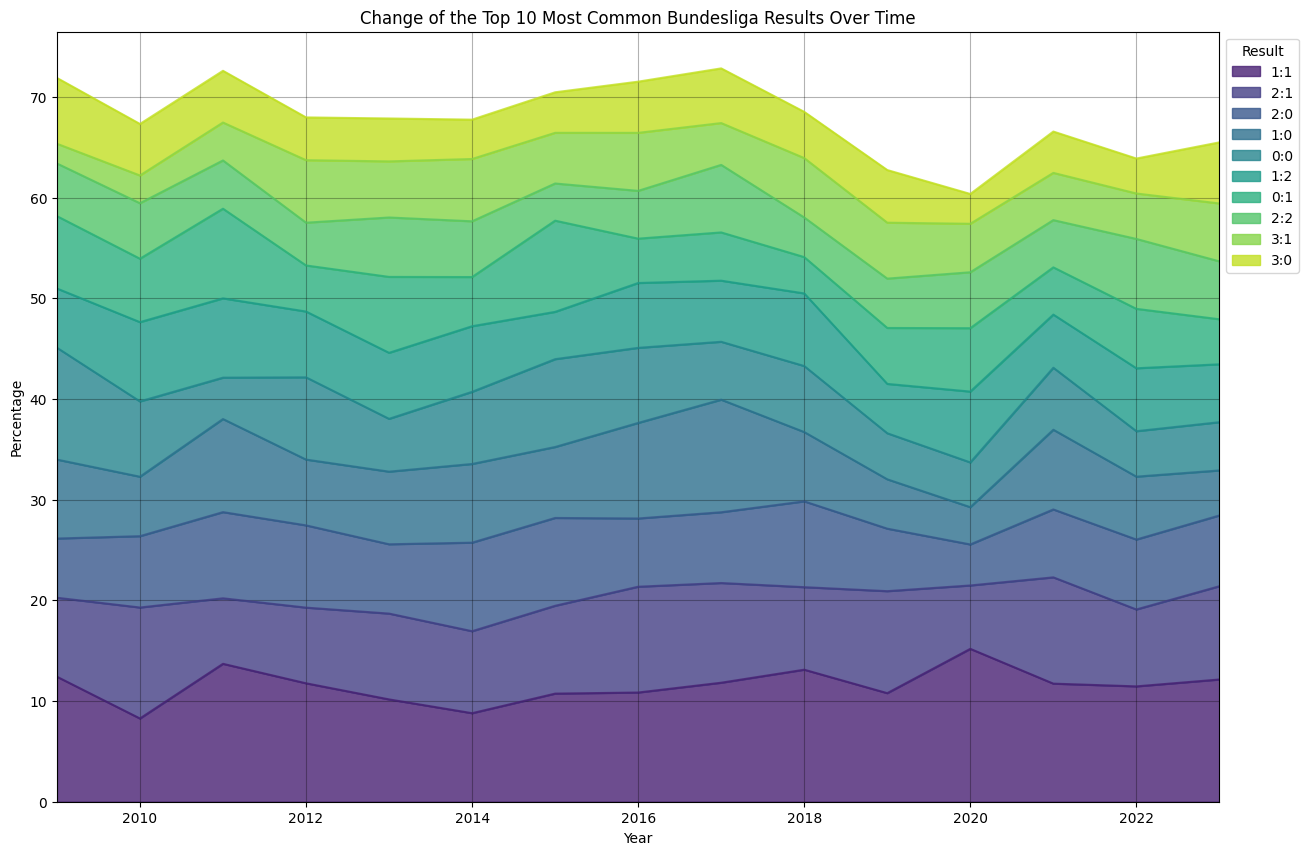
This graph is a stacked area chart showing the changes in the percentages of the top 10 most common Bundesliga match results from 2009 to 2023. The x-axis represents the years, while the y-axis indicates the percentage of matches that ended in each specific result. Each color in the chart corresponds to a specific match result, such as 1:1, 2:1, 2:0, and so on. The 1:1 result is the most common throughout the period, consistently occupying the largest area. The results 2:1, 2:0, and 1:0 also frequently appear, indicating their regular occurrence in matches. There is a noticeable increase in 2:0 and 2:1 outcomes around 2014-2018, while 0:0 results slightly decrease post-2020. The overall percentage of these top 10 results remains high, often surpassing 70%, showing their dominance in match outcomes.
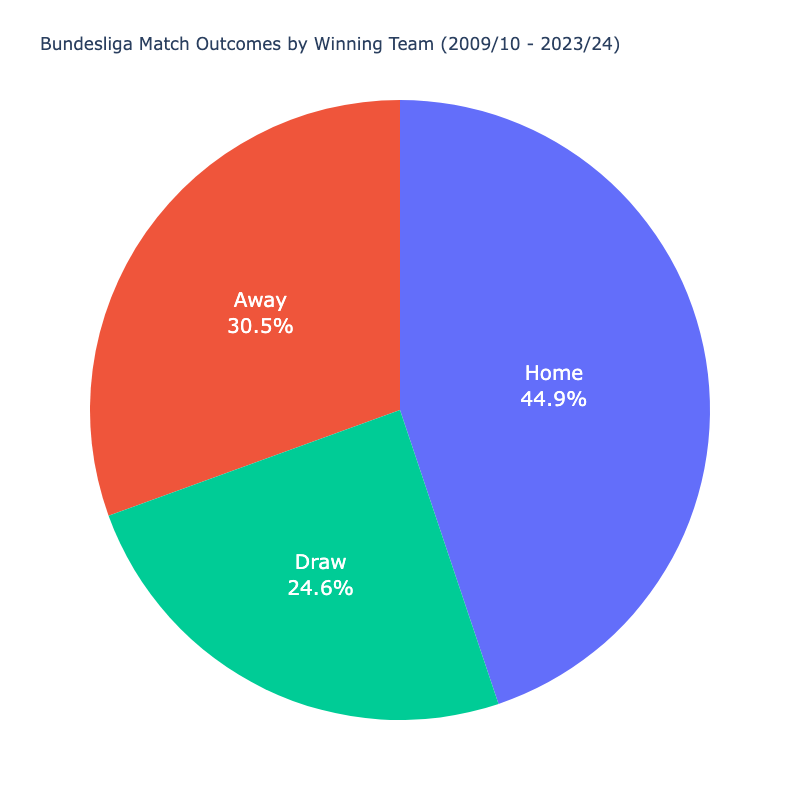
This pie chart illustrates the distribution of Bundesliga match outcomes by the winning team from the 2009/10 season to the 2023/24 season. The chart is divided into three sections, each representing a different type of match result: home win, away win, and draw.
Why Home Teams Win More Often
Playing at home provides teams with the advantage of familiar surroundings, including the pitch, changing rooms, and even the local climate. Additionally, home teams benefit from the support of their local fans, which can boost player morale and create an intimidating atmosphere for the visiting team. The reduction in travel fatigue also plays a crucial role, as away teams often have to travel long distances, which can affect their performance. Lastly, referees, albeit subconsciously, may be influenced by the home crowd, potentially leading to favorable decisions for the home team. These factors combined contribute to the higher percentage of home wins in the Bundesliga.
Most First Goals are Scored between the 5th and 12th Minute
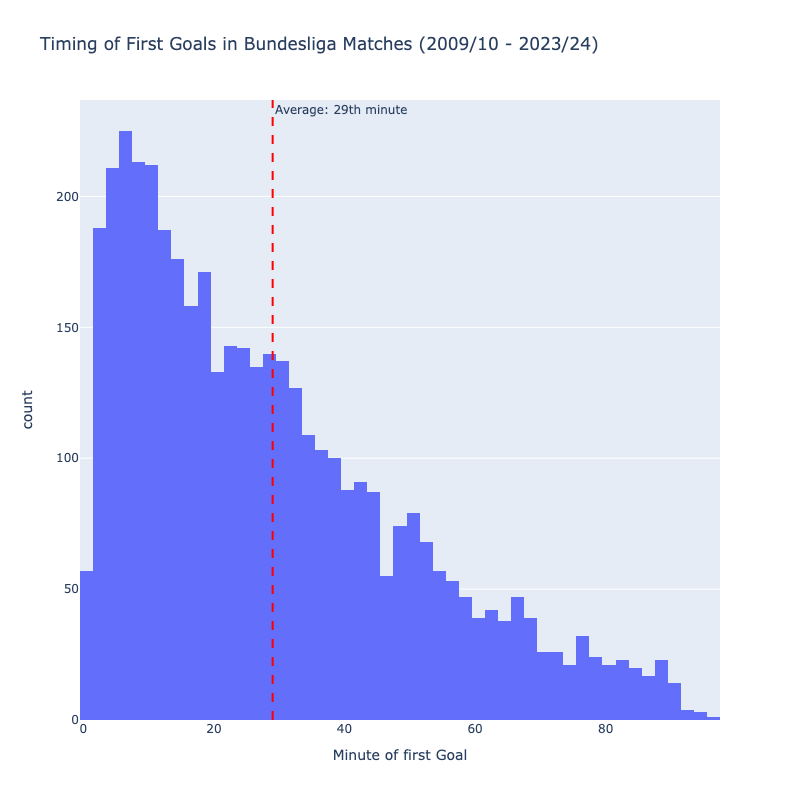
This histogram illustrates the distribution of the first goal timing in Bundesliga matches from the 2009/10 season to the 2023/24 season. The x-axis represents the minute of the match when the first goal was scored, and the y-axis represents the count or frequency of matches that had their first goal scored at each minute.
The chart shows that the majority of first goals are scored within the first 30 minutes of the match, with the highest frequency occurring between the 4th and 20th minutes. There is a noticeable peak around the 10th minute, indicating that first goals are commonly scored early in the match. After the initial 30 minutes, the frequency of first goals decreases steadily as the match progresses. Fewer first goals are scored in the latter stages of the first half and during the second half of the match. The red dashed line on the chart represents the average timing of the first goal, which is around the 29th minute.
The Precision in Calculating Betting Odds
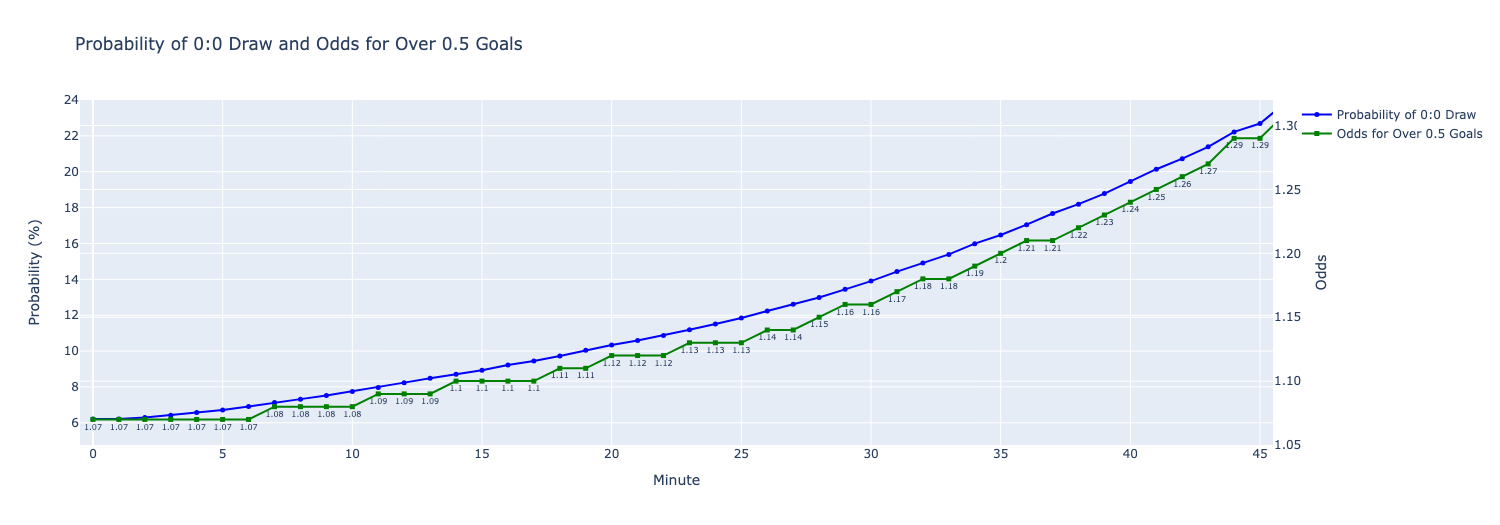
This graph illustrates the relationship between the probability of a 0:0 draw and the odds for over 0.5 goals across different minutes of a match. The x-axis represents the minutes of the game, ranging from 0 to 45, while the left y-axis shows the probability percentage, and the right y-axis displays the odds. The blue line represents the increasing probability of a 0:0 draw as the match progresses, starting at around 6% and reaching up to nearly 24%.
The green line shows the odds for over 0.5 goals, which also rise as time passes, starting just above 1.07 and climbing to around 1.29. Both lines follow a similar upward trend, indicating that as the game progresses, both the likelihood of a 0:0 draw and the odds for over 0.5 goals increase. The alignment of the two lines suggests a close correlation between the rising probability of a draw and the changing odds for goals. This graph effectively shows how in-play betting odds and probabilities adjust as a match moves towards halftime. As you can see the odds for over 0.5 goals are always below the probabilit that there won’t be any goals in the match. Can you even win on the long run?
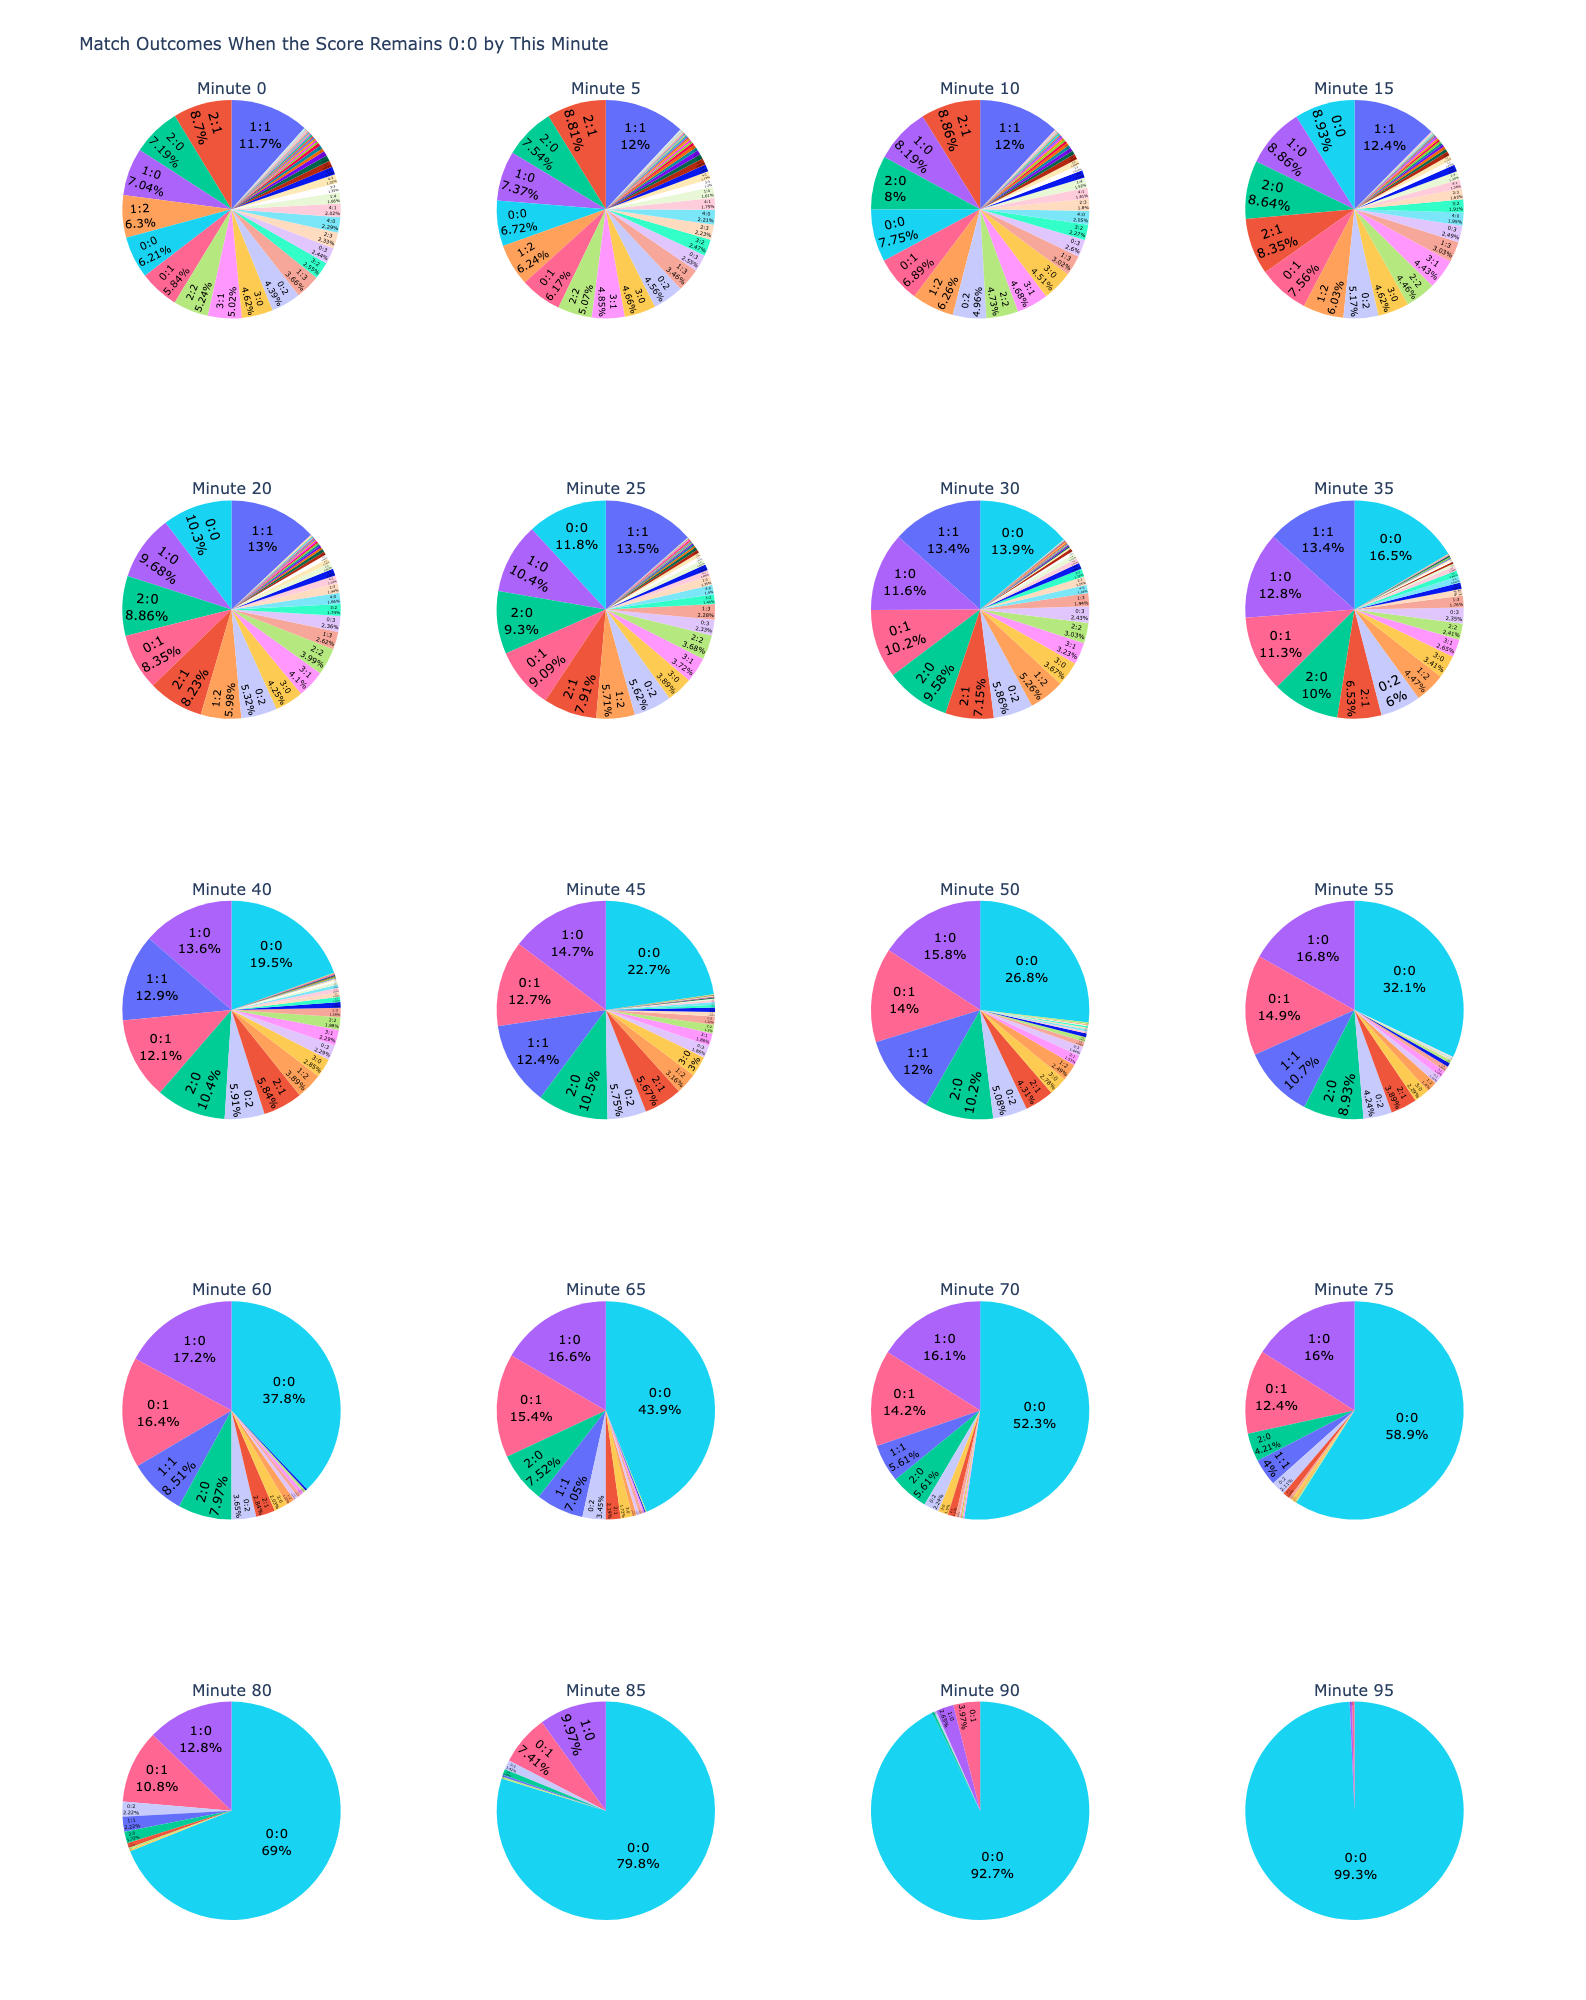
This series of pie charts illustrates the distribution of match outcomes in the Bundesliga based on the time when the score remains 0:0. Each pie chart represents a different minute interval, starting from minute 0 up to minute 95. Initially, the match outcomes are diverse, with a variety of scores being equally probable. As the game progresses, the probability of a 0:0 draw increases significantly, especially after the 60th minute. By the 90th minute, the 0:0 draw becomes the most dominant outcome, comprising over 90% of the results. This trend highlights that as more time passes without a goal, the likelihood of the match ending in a 0:0 draw increases substantially.
Conclusion
I hope you enjoyed reading this! Stay tuned for the next post, where we’ll delve into building our own value betting strategy using these insights and more data. Read Part 2
All graphics were created by me and are available for non-commercial use. Please note that the analysis and calculations presented here may contain errors.